Cut your power bill
We shave your monthly peak demand and shift usage to cheap off-peak hours — typically 20–40% off the electricity line.
BLOQ ENERGY · TURNKEY COMMERCIAL BATTERY STORAGE
We install, operate and optimize your battery storage. Hardware, software, installation and incentives across Canada.
Multifamily · Hospitality · Retail · Commercial · Industrial
Takes 30 seconds. Federal & provincial incentives matched to your address.
24-hour dispatch
The battery fills up on cheap overnight power, then runs the building through the expensive afternoon peak — cutting demand charges every single day.
Off-peak grid rate ≈ 2.8¢/kWh
≈ $109k per year (illustrative)
LIVE DISPATCH MODEL
A working illustration of a 500 kW / 1 MWh system on a Canadian commercial tariff across one billing day.
Saved today
$0
00:00
State of charge
27%
3.2¢ / kWh · 500 kW / 1 MWh
1. Buy energy at the bottom of the curve
Between roughly midnight and 6 a.m. Canadian grids are lightly loaded and off-peak energy prices fall to a few cents per kWh. The system charges to full during that ultra-low window, when the marginal cost of a stored kWh is at its lowest point of the day.
2. Hold through the shoulder hours
Mid-day prices are not high enough to justify a cycle. The battery sits idle, losing only a fraction of a percent to standby, while the control system forecasts the day's coincident peak from meter data and weather.
3. Discharge across the peak window
When facility load and grid price climb together — typically late afternoon in summer and early evening in winter — the battery discharges into the building. The meter never sees that demand, so the billing peak that sets your demand charge is clipped.
4. Two savings streams, one asset
You capture the price spread on the energy you shifted, plus the far larger demand charge avoidance on the kW you removed from the billing peak. In most Canadian C&I tariffs the demand charge component drives 60–80% of total value.
Illustrative dispatch on an indicative price curve. Actual charge and discharge schedules are optimized against your utility's rate schedule and interval data.
What we do
You provide your energy data. We confirm the business case, design and install the right system, then operate it every day. One partner is accountable for the complete result.
What the system does for you
The battery works every day and remains available when the grid goes down.
We shave your monthly peak demand and shift usage to cheap off-peak hours — typically 20–40% off the electricity line.
The same battery becomes backup power for critical loads during outages, with no diesel and no fuel logistics.
We stack the 30% federal ITC with provincial and utility programs, so a large share of the project cost comes back to you.
From first file to daily operation
We lead every stage and give you a clear decision point before moving to the next one.
You send one year of utility bills or 15-minute interval data. We model savings, battery size and payback — free, no obligation.
We engineer the system, file the utility interconnection and permits, and lock in every incentive you qualify for.
Our crews handle civil work, the pad, high-voltage hookup and commissioning. One provider, one contract, one schedule.
Our AI dispatch software runs the battery every day, and we monitor, maintain and warranty it for 10–15 years.
Turnkey scope
You do not have to coordinate manufacturers, engineers, contractors, utilities and operators — we do.
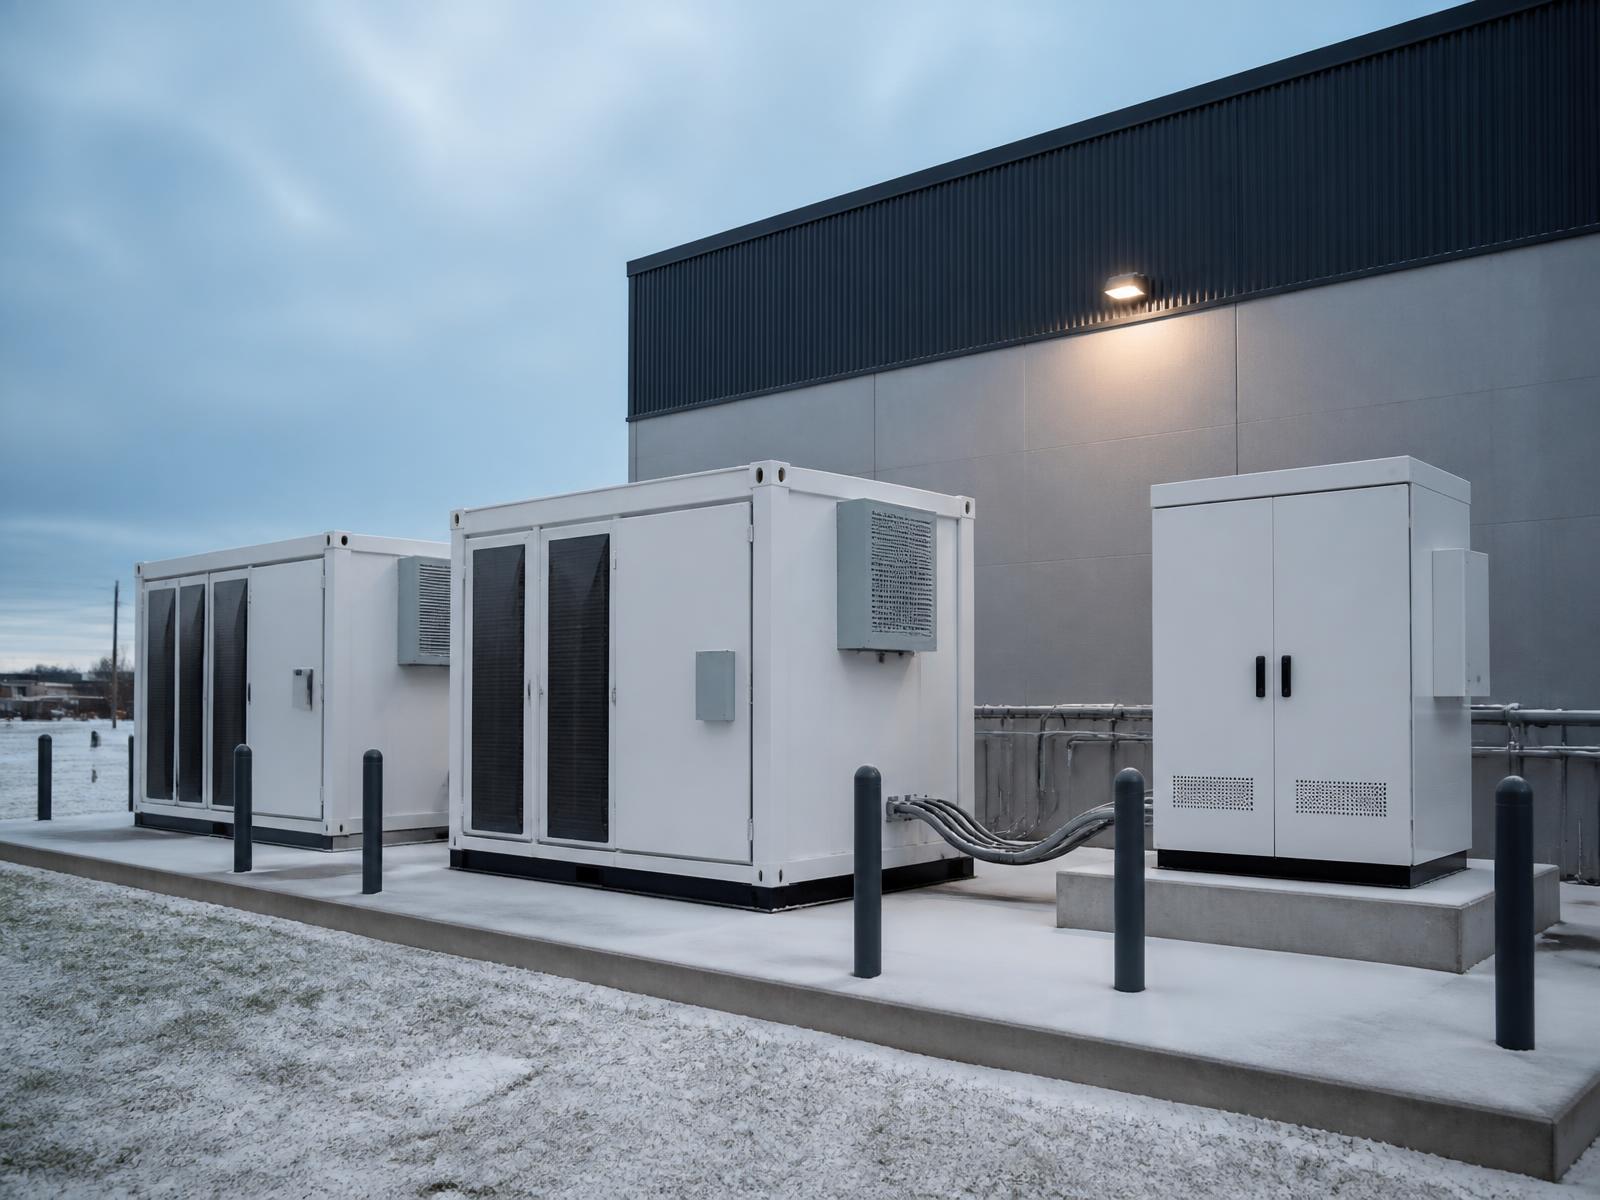
Canadian-certified (CSA C22.2 No. 340, UL 9540, NFPA 855) outdoor liquid-cooled LFP battery enclosures, scaled to your site.
AI energy management that auto-dispatches peak shaving, predicts Ontario Class A Global Adjustment peaks and arbitrages Alberta AESO prices.
Single-line diagrams, protection studies, utility interconnection filings (Hydro One, Toronto Hydro, ENMAX, BC Hydro) and AHJ permitting.
On-site civil work, structural concrete pad, high-voltage electrical hookups and commissioning by certified Canadian electricians.
Clean Technology ITC support and optional equipment financing, tailored to your project and budget.
24/7 remote monitoring, thermal health tracking, preventative maintenance and 10-to-15-year capacity degradation warranties.
Interval assessment engine
Drop your raw utility CSV, XLSX, or Green Button XML data to run a true load-curve dispatch simulation for your building.
Drag & drop your file here
CSV · XLSX · XML · PDF
Incentives & Grant Explorer
Combine 30% Federal Tax Credits with utility grants in Ontario and BC, plus Hydro-Québec winter peak credits.
Hover or tap a province to see its incentive
IESO + local distribution companies
AESO (energy-only market)
Hydro-Québec
BC Hydro
Manitoba Hydro
Nova Scotia Power
SaskPower
NB Power
Newfoundland Power / NL Hydro
Maritime Electric
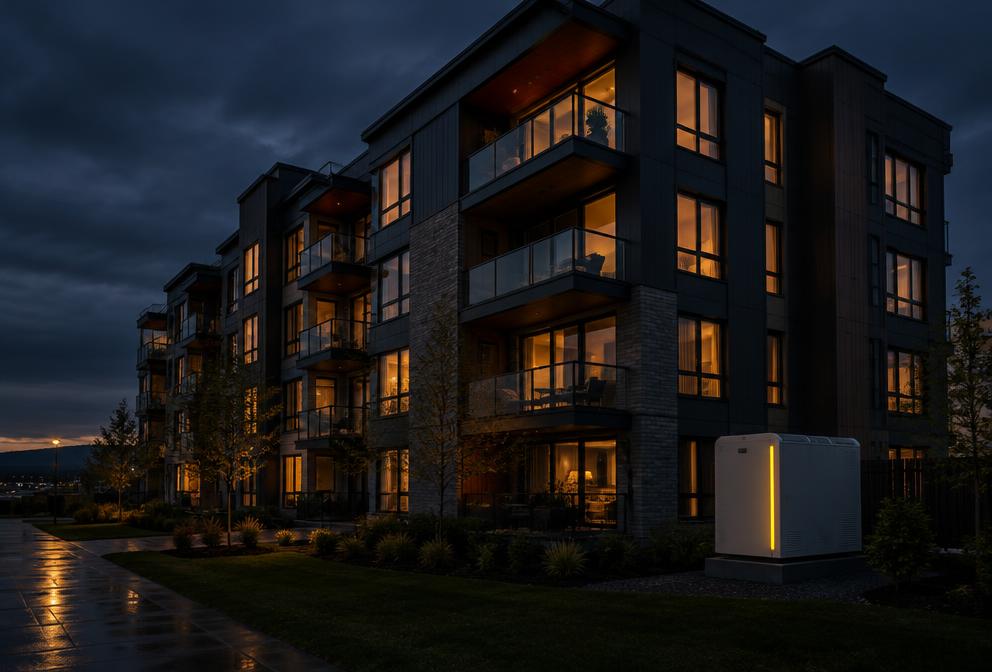
Multi-residential buildings carry evening peaks driven by elevators, HVAC, common-area load and increasingly resident EV charging. Storage flattens the evening ramp and defers costly service upgrades.
22% typical peak reduction
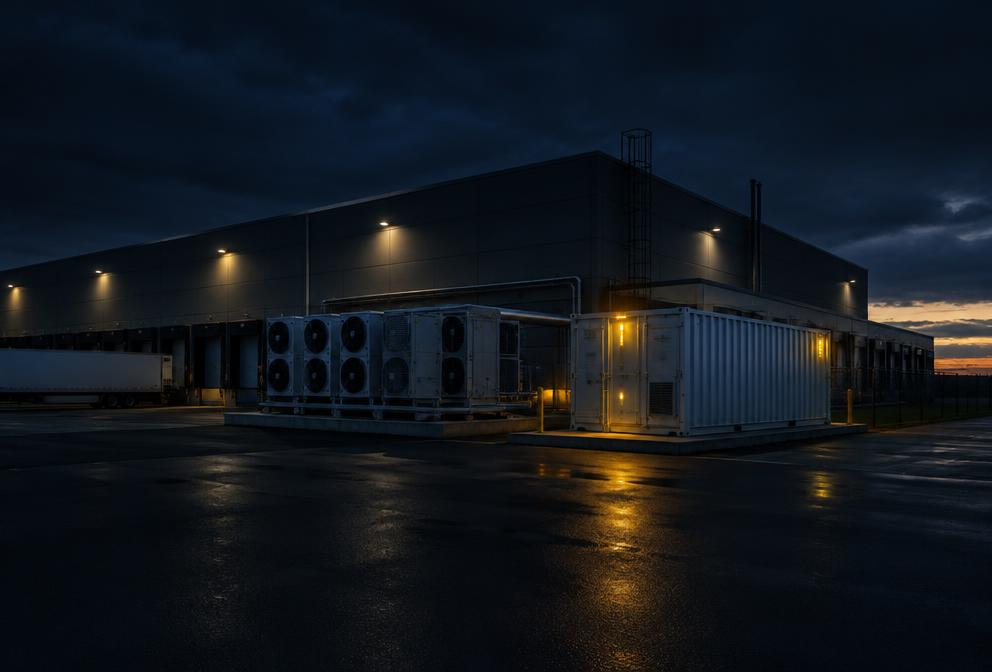
Refrigeration compressors create sharp, repeatable demand peaks with significant thermal inertia. Cold-storage sites regularly show the strongest BESS payback in Canada.
35% typical peak reduction
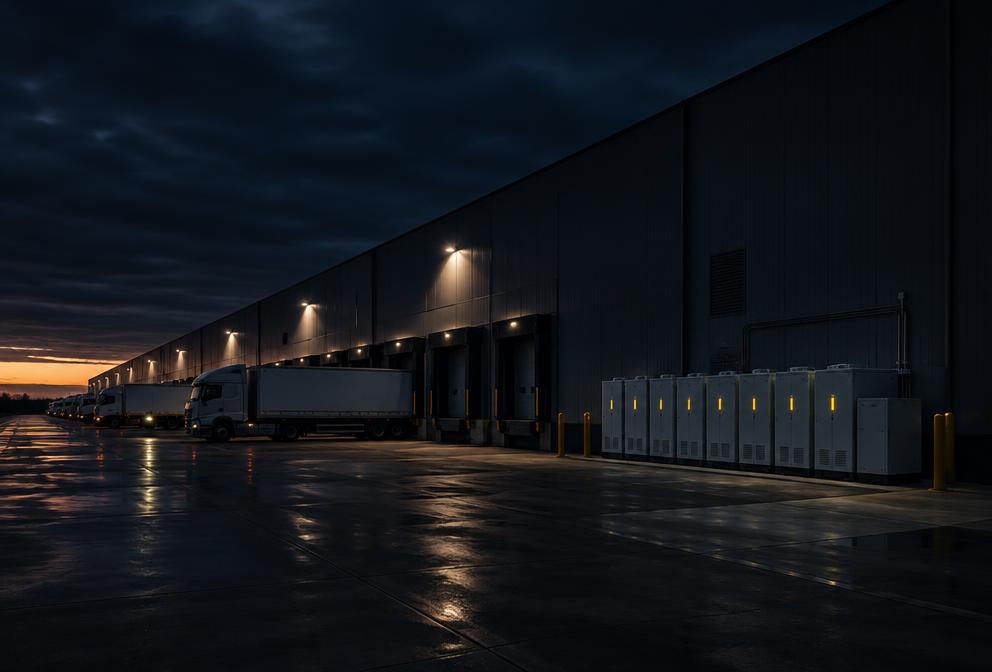
Distribution centres combine material-handling loads, battery-charging bays and fleet electrification, producing steep short-duration peaks well suited to 2-hour storage.
28% typical peak reduction
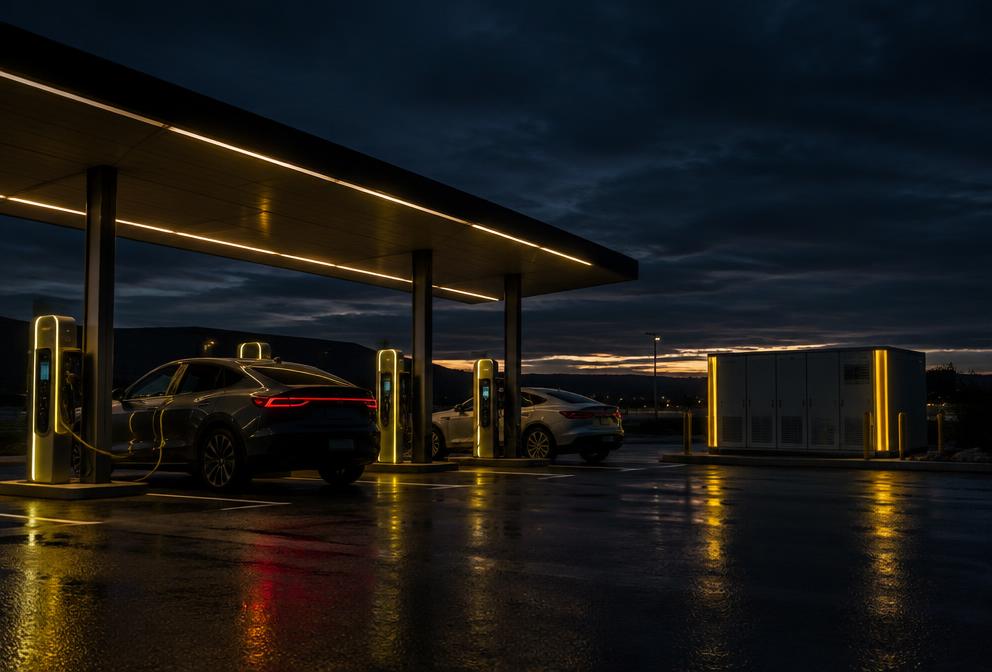
DC fast-charging sites are demand-charge dominated: a handful of simultaneous sessions can set the monthly peak. Buffered storage lets a site serve high-power charging on a smaller service.
45% typical peak reduction
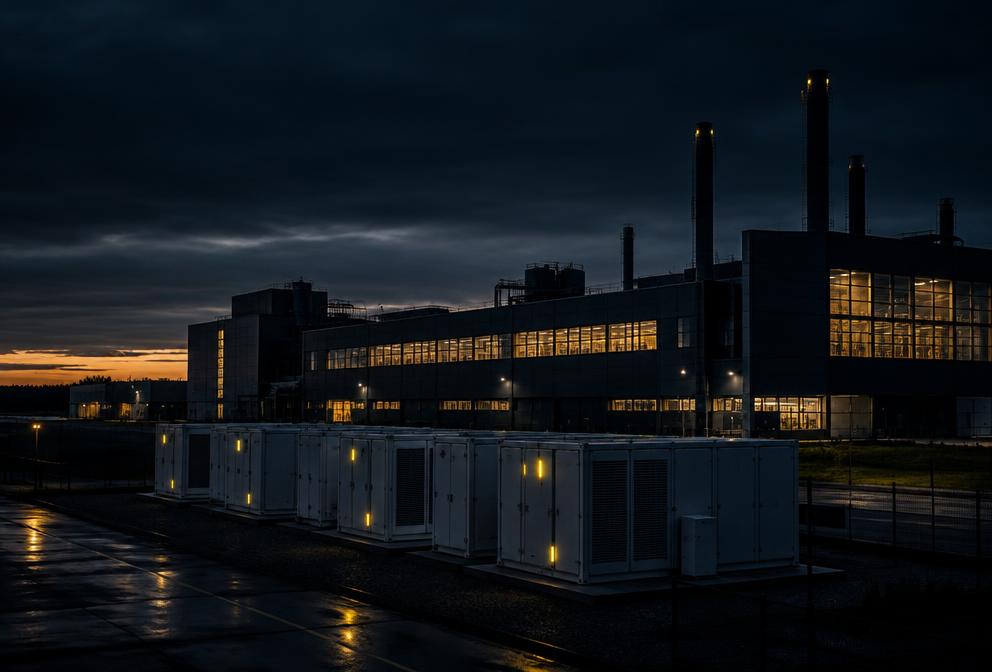
Process loads, welders, motors and batch operations create high coincident peaks. In Ontario, Class A Global Adjustment avoidance can exceed demand-charge savings.
30% typical peak reduction
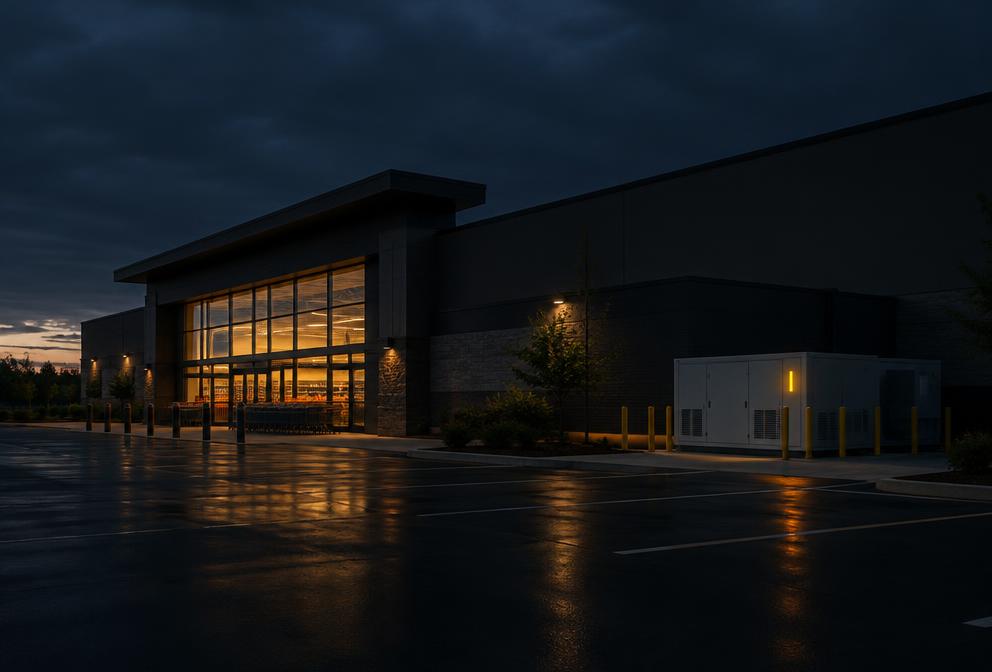
Grocery and big-box retail combine refrigeration, HVAC and lighting into predictable midday summer peaks — a good fit for a compact 100–500 kW system.
24% typical peak reduction
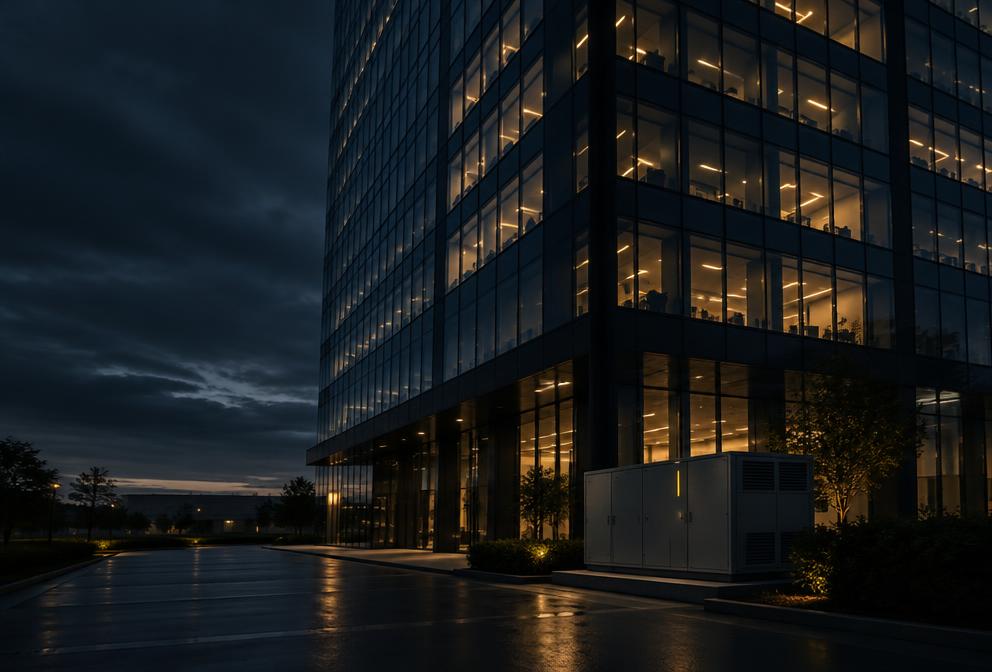
Office towers, schools and healthcare properties value predictable demand reduction plus resilience for critical circuits during outages.
20% typical peak reduction
Estimates are preliminary and non-binding. Tariff figures are indicative and must be verified against current utility rate schedules. Final system design requires interval data, a site assessment and stamped engineering.
Free site analysis
Tell us a little about your site. An engineer will reply with a no-obligation savings estimate.